Services
Find where your store can grow. Then capture it permanently.
Stores grow three ways: more people find you, your ads earn more, and more visitors buy. The Growth Blueprint finds which one returns the most for your next dollar and proves it with manual tests before anything gets built. Then we build the AI system that captures it permanently, scoped to your store, not pulled from a catalog.
The Growth Blueprint
$5K–$10K fixed fee · 3–6 weeks · no ongoing commitment
We analyze all three growth areas against your real numbers, rank your opportunities by projected revenue, and then verify the top ones with manual tests against your actual store. Every engagement starts here, even when you already know what you want built.
You keep the validated test results, and the roadmap, either way. If a test says stop, that's a five-figure build you didn't waste, not a failure.
Request a Growth BlueprintAI systems built into your store
Built for the opportunities the Blueprint proved are worth funding
Not campaigns that stop when the retainer stops. Software that runs in your accounts, operated by your team.
Custom-built for your catalog, margins, and stack. The named systems are examples, not a menu. Once built, they're yours: no retainer, no revenue share, just vendor running costs of a few hundred dollars a month.
See how Phase 2 worksThe three growth areas
Every store's biggest opportunity lives in one of these. The Blueprint tells you which.
Growth area 1 · Organic marketing
Organic Growth
More customers finding you without paying for every click.
Shoppers find products through Google, TikTok and Pinterest search, YouTube reviews, and AI assistants that recommend specific brands. Every month you don't show up there, you rent that customer through ads. We find the searches and questions your products should own, and structure your catalog so AI assistants recommend it. The Blueprint measures how much of that discovery you own before anything gets built.
- The searches and AI prompts your customers actually use, mapped to your catalog
- Category pages rebuilt to rank and convert
- Fastest wins first: rankings you're closest to capturing
- What your content is missing versus competitors who outrank you
Example system: Keyword Intelligence System
Maps every product in your catalog to the searches it should rank for. For a footwear brand with 180+ products, that meant going from 9–12 months of manual research to full coverage in under two weeks, with their own team running it.
Internally we call this Demand Ownership.
Growth area 2 · Paid marketing
Paid Growth
Know which ads make money, not just sales.
An ad can return $4 for every $1 spent and still lose money after product costs, shipping, and returns. Platform dashboards don't show that. We track what each campaign actually earns, with rules set in advance: losing spend stops, proven spend scales. The Blueprint quantifies how much budget is quietly losing money before any system is built.
- Profit tracked by channel and campaign, not just ROAS
- Clear rules set in advance for cutting and scaling spend
- Ads taking credit for sales you'd get anyway, exposed
- Budgets that stay in your accounts, under your control
Example system: Ad Spend Monitoring System
Checks every campaign against your profit thresholds daily and flags where to cut and where to double down, before a bad month becomes a bad quarter. The average brand recovers about a third of its ad spend.
Internally we call this Acquisition Efficiency.
Growth area 3 · Conversion (CRO)
Conversion Growth
Sell more to the traffic you already paid for.
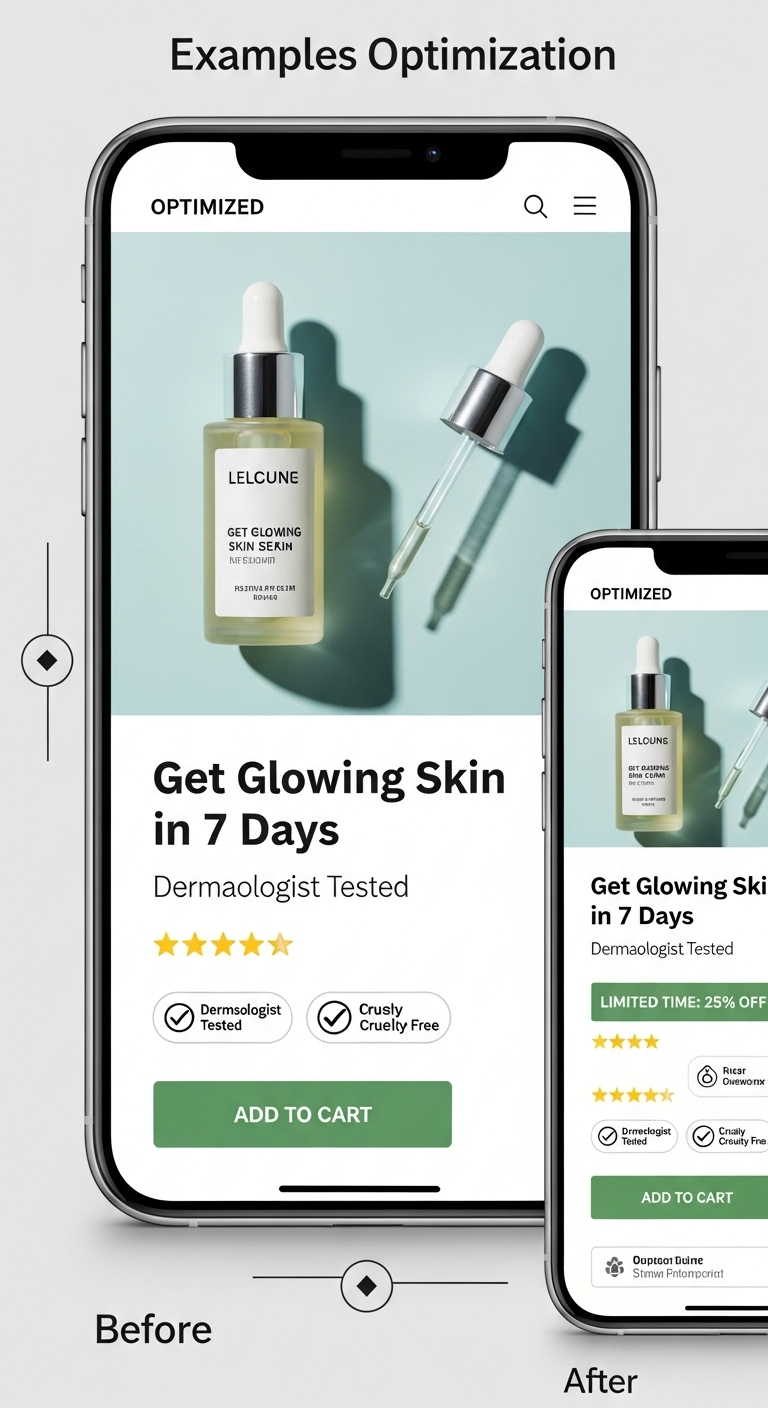
You already paid for every visitor. If product pages or checkout leak buyers, or every order ships with one item, fixing that beats buying more traffic. We find the leaks and the products that should be offered together. The Blueprint prices each leak in dollars before we build anything to plug it.
- Fix where mobile shoppers give up
- Checkout friction found and removed
- Offers built from products that sell together
- Bigger orders from traffic you already own
Example system: Bundle Logic System
Learns which products sell together and builds the offers automatically. For one home goods brand, that raised average order size 28%, about $800K a year in projected new revenue.
Internally we call this Yield Expansion.
Find your best growth opportunity.
The Growth Blueprint tells you where your store grows next, what it's worth, and proves it with manual tests. In 3–6 weeks, for a fixed fee.
Fixed fee, no ongoing commitment · You keep the validated test results either way